Welcome to Software Development on Codidact!
Will you help us build our independent community of developers helping developers? We're small and trying to grow. We welcome questions about all aspects of software development, from design to code to QA and more. Got questions? Got answers? Got code you'd like someone to review? Please join us.
How to plot table from pandas dataframe
MWE
import pandas as pd
import numpy as np
import matplotlib.pyplot as plt
df = pd.DataFrame(np.random.rand(9, 4), columns=['a', 'b', 'c', 'd'])
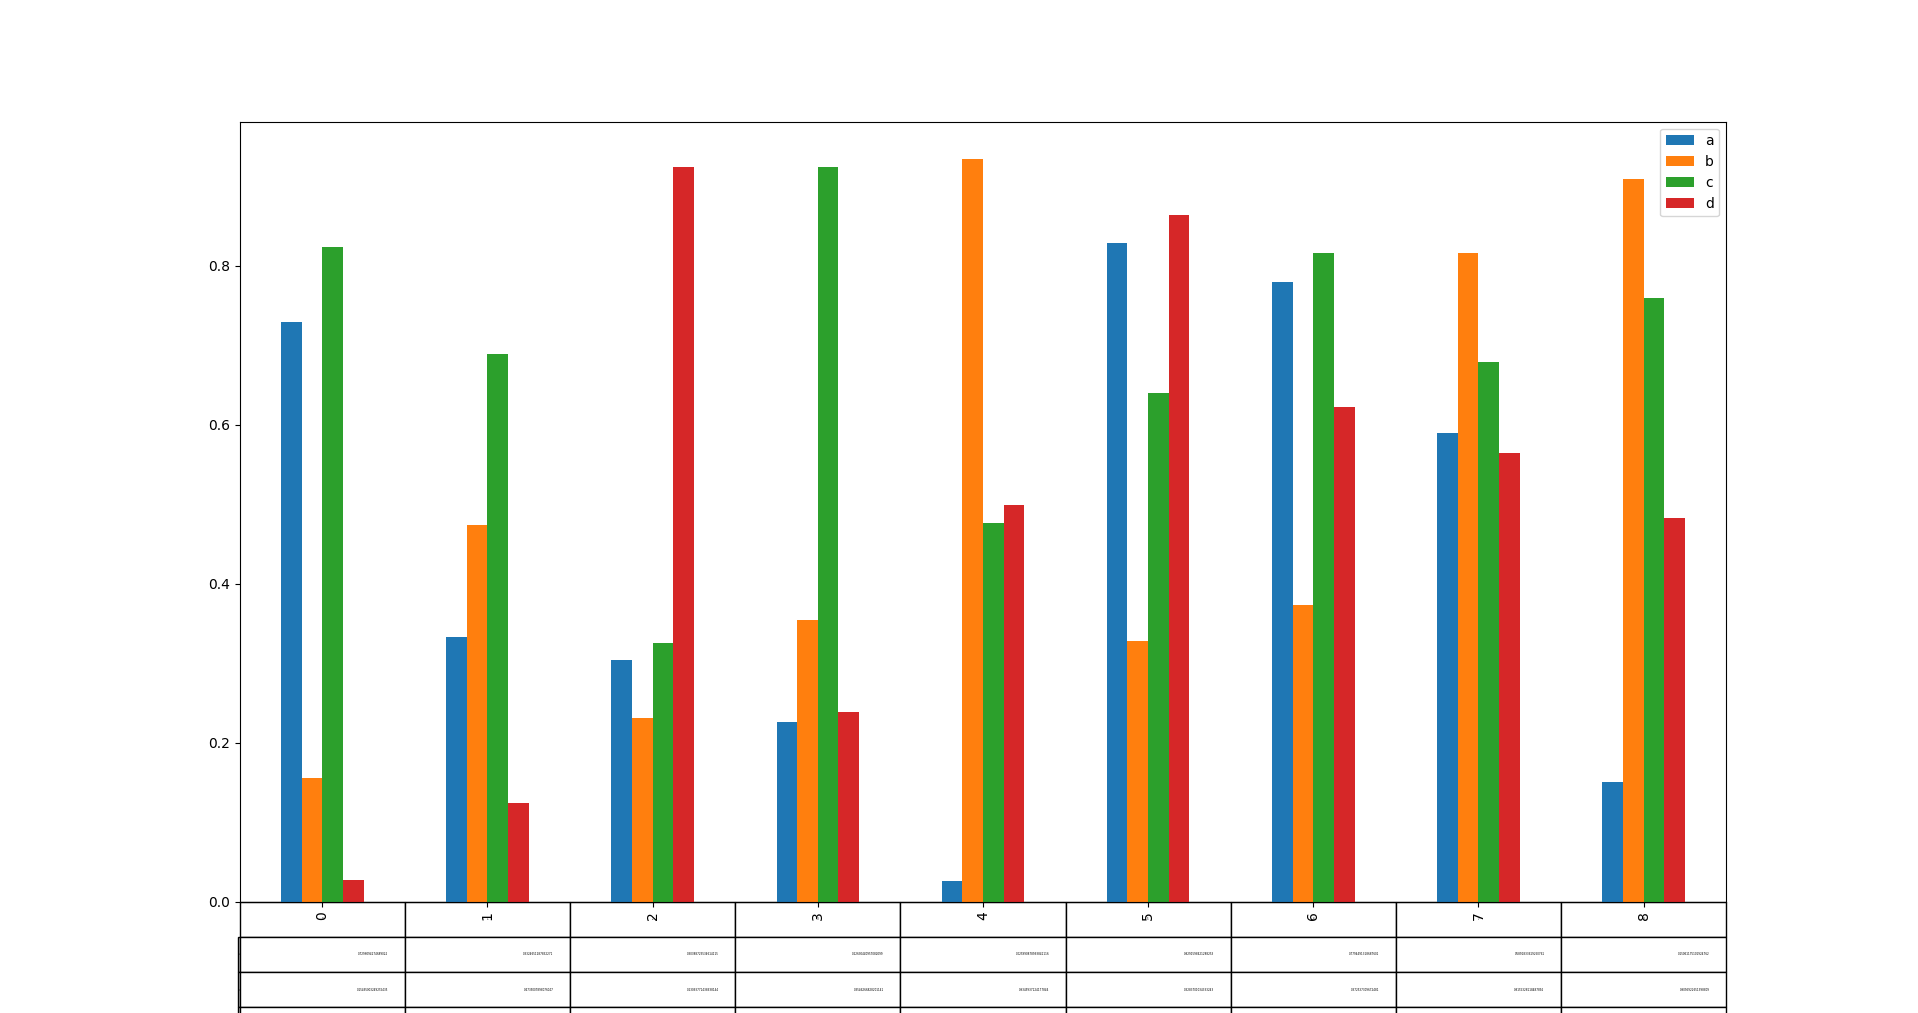
df.plot.bar(table=True) # don't want plot, just want table
# df.plot.table() # what I would hope
plt.show()
Question
How do I generate a table in its own figure from a pandas dataframe?
Notes
Notice the table appended to the graph above is hardly legible and gets cut off. I am not looking to fix legibility as is though, I need a separate figure for use in a paper.
I do not want to have to mess with generating matplotlib axes objects like for pandas.plotting.table() or in this example.
I want to be able to create the table just using and providing the df, as opposed to manually formatting the data into a latex table.
1 answer
The following users marked this post as Works for me:
| User | Comment | Date |
|---|---|---|
| mcp | (no comment) | Aug 2, 2022 at 00:42 |
If you want a table for including in a latex document, then DataFrame.to_latex should be the best way.
import pandas as pd
import numpy as np
df = pd.DataFrame(np.random.rand(9, 4), columns=['a', 'b', 'c', 'd'])
print(df.to_latex())
Output:
\begin{tabular}{lrrrr}
\toprule
{} &         a &         b &         c &         d \\
\midrule
0 &  0.883901 &  0.910674 &  0.306624 &  0.470303 \\
1 &  0.922612 &  0.219801 &  0.611842 &  0.743910 \\
2 &  0.996779 &  0.379242 &  0.674361 &  0.782147 \\
3 &  0.765185 &  0.011737 &  0.884637 &  0.162817 \\
4 &  0.845882 &  0.916658 &  0.244468 &  0.497107 \\
5 &  0.304585 &  0.047682 &  0.180011 &  0.399425 \\
6 &  0.720945 &  0.906463 &  0.845129 &  0.151063 \\
7 &  0.998912 &  0.631897 &  0.504105 &  0.633605 \\
8 &  0.523401 &  0.322309 &  0.507168 &  0.843320 \\
\bottomrule
\end{tabular}
0 comment threads

1 comment thread